'Enough Trump or Sanders samples to wall paper a small room...'
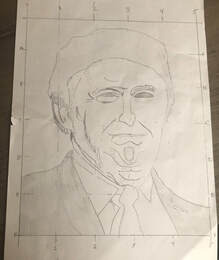
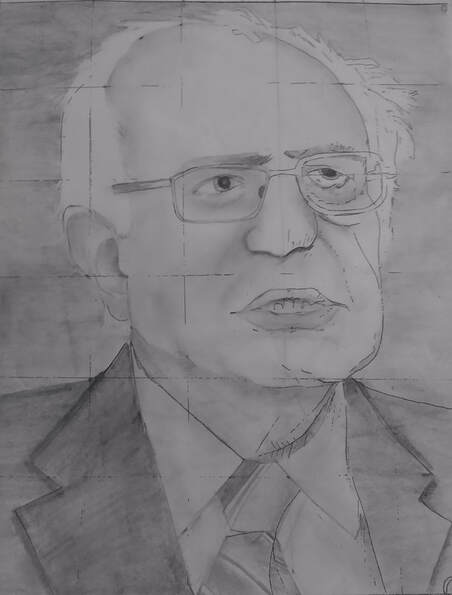
MINOR VARIATIONS: Graphs of Trump by Alex Payne (L) and Matt Ribble (R) demonstrate how variations can occur when plotting coordinates on the enlarged grid. Notice especially differences in the spacing of the eyes and nose. Despite the differences, both students got good likenesses and solid foundations for the next phase of the project: shading to make the faces look 3D.
|
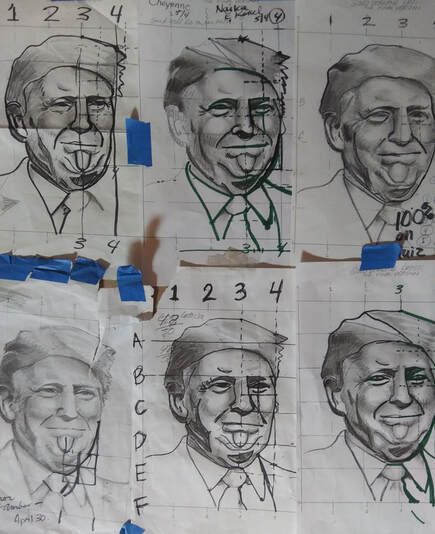
A sampling of the 24 grid enlargements done with students remotely during the COVID 19 closure. Wallpaper, anyone?
Within a week of the school closure, we were up and running with Google Meetings where students could come on live video for help. The results over the next eight weeks were dozens of 1-on-1 or small group tutoring sessions and enough Trump and Sanders samples in Mrs. B's house to wall paper a small room.
SLIDE SHOW: Please hover on main image, then click "PLAY."
|
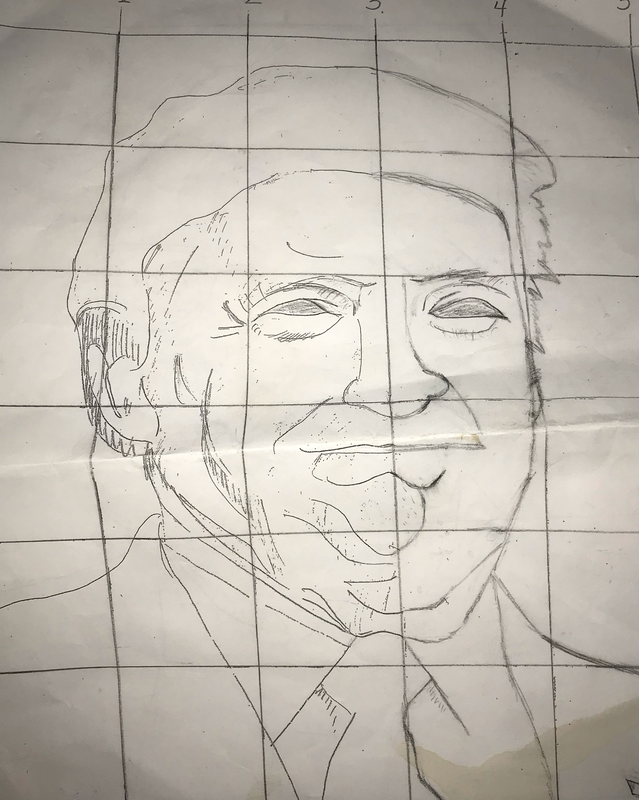
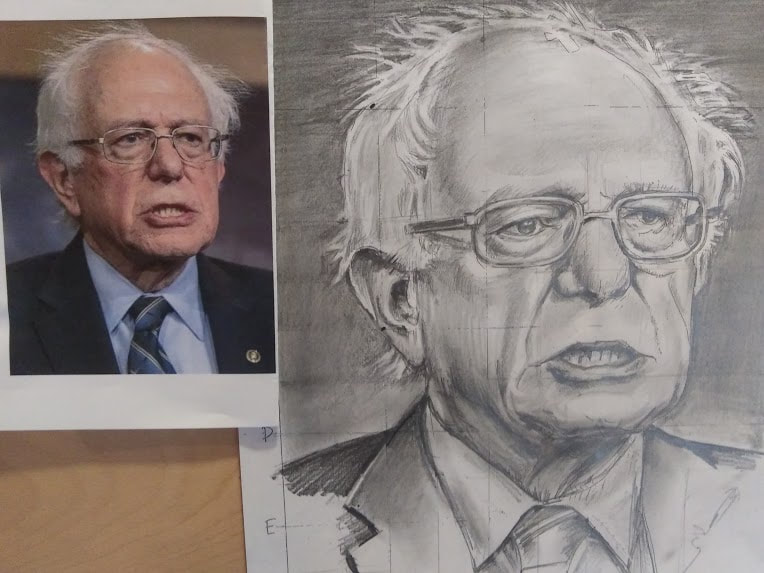
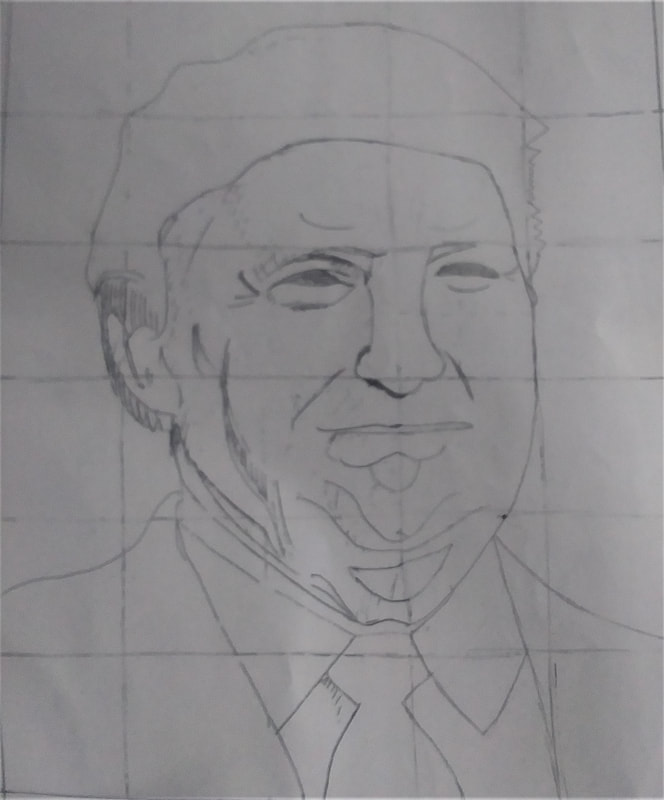
CARTOGRAPHED CANDIDATES -- Grid enlarging a portrait, in a way, is a lot like mapping: the artist must draw to scale an accurate "coastline" and then place the "topographical features" of the face -- nose, eye sockets, cheekbones, lips, chin -- in just the right places. For every "hill," there is a "valley." The hills catch the light and cast shadows on the lower areas beside them. The deeper the valley (mouth, nostrils, ear canal, etc.), the darker. The tighter the crevice (a wrinkle, a dimple, a squinting eye), the darker, as well, until the light on the neighboring swell of flesh curves down and begins to dissolve the shadows in the depths.
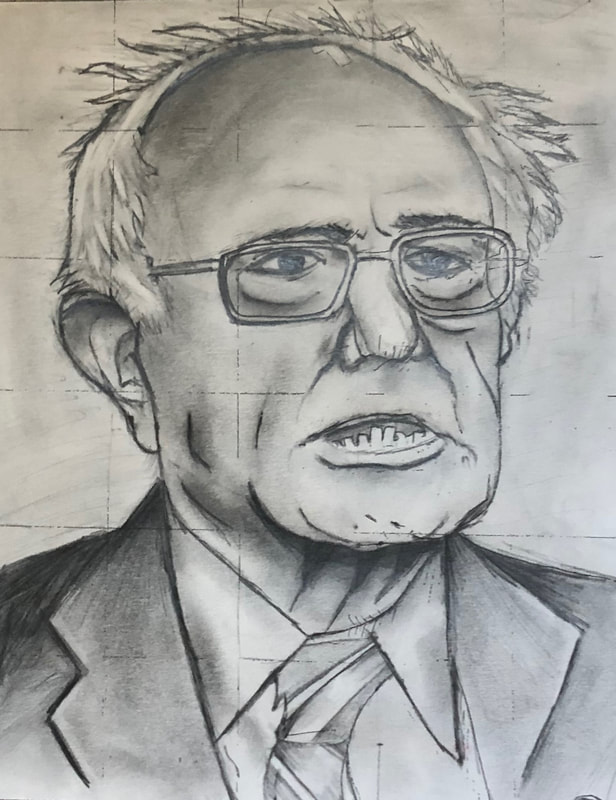
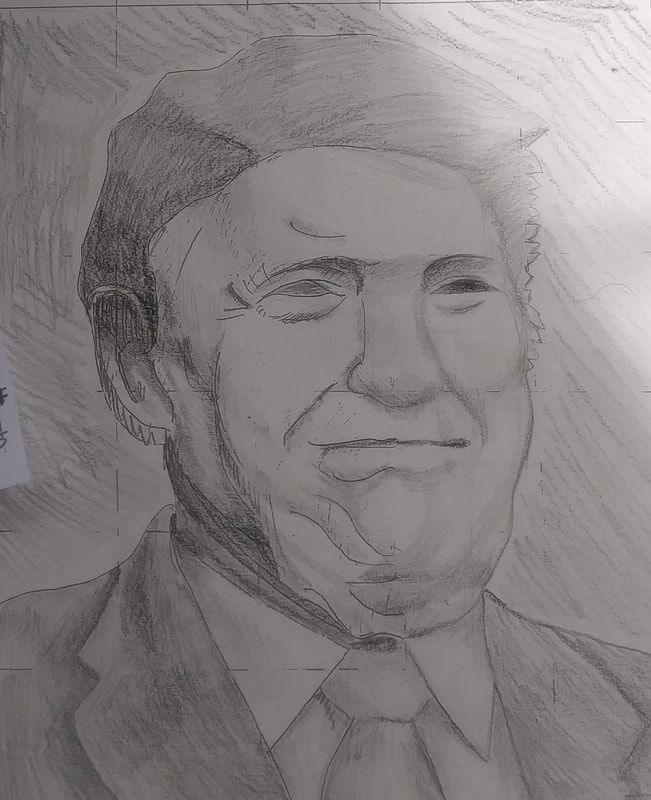
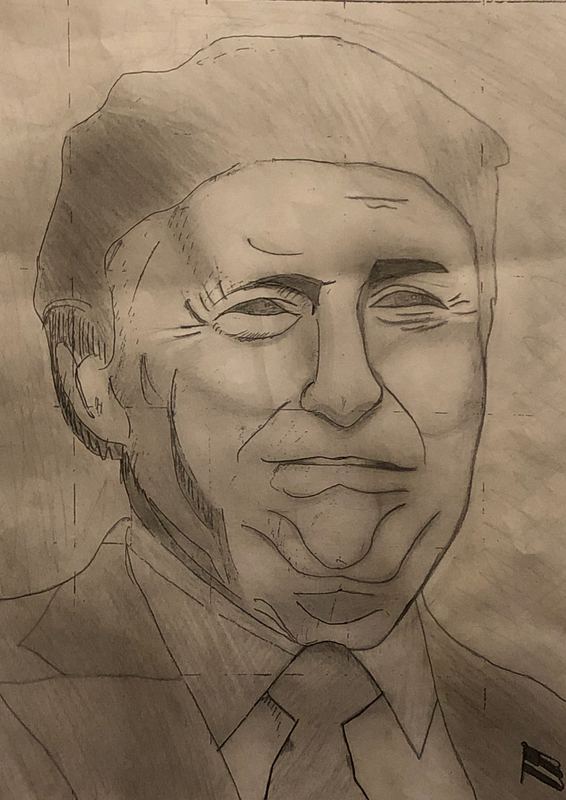
For an artist, capturing "the scene" is all about modulating the darks and the lights. The portraits below exemplify that developing skill.
(Clockwise from upper left) Sanders by Ella Dimezza, Trump by Maryum N., Sanders by Rebecca Towne and Trump by Hailie Ruf
For an artist, capturing "the scene" is all about modulating the darks and the lights. The portraits below exemplify that developing skill.
(Clockwise from upper left) Sanders by Ella Dimezza, Trump by Maryum N., Sanders by Rebecca Towne and Trump by Hailie Ruf
|
|
|
|
